---
title: CPU Performance
layout: docs
nav: machines
---
We offer two kinds of virtual CPUs for Machines: `shared` and `performance`. Both run on the same physical hardware, have the same clock speed, etc... The difference is how much time they are allowed to spend running your applications.
| CPU Type | Period<sup>1</sup> | Baseline Quota<sup>1</sup> | Initial Burst Balance<sup>1</sup> | Max Burst Balance<sup>1</sup> |
|---------------|--------------------|----------------------------|-----------------------------------|-------------------------------|
| `shared` | 80ms | 5ms (6.25%) | 5s | 500s |
| `performance` | 80ms | 80ms (100%) | - | - |
We enforce limits through the [Linux scheduler's CPU bandwidth control](https://www.kernel.org/doc/Documentation/scheduler/sched-bwc.rst) by adjusting the `cpu.cfs_quota_us` setting on each machine cgroup. For each 80ms period of time, we set a quota of 5ms for each `shared` vCPU, or the full 80ms period for each `performance` vCPU. If your machine cgroup's CPU usage reaches its quota, its tasks will be 'throttled' (not scheduled to run again) for the remainder of the 80ms period.
Quotas are shared between a Machine's vCPUs. For example, a `shared-cpu-2x` Machine is allowed to run for 10ms per 80ms period, regardless of which vCPU is using that time.
<sup>1</sup> We might change these specific numbers over time.
## Bursting
APIs and human-facing web applications are sensitive to latency and a 75ms pause in program execution is often unacceptable. These same types of applications often work hard in small bursts and remain idle much of the time. To improve the performance of `shared` vCPUs for these applications, we allow a balance of unused CPU time to be accrued. The application is then allowed to spend its balance in bursts. When bursting, the vCPU is allowed to run at up to 100%. When the balance is depleted, the vCPU is limited to running at its baseline quota.
Because the burst balance is only used for utilization above the baseline quota, the amount of time a machine can _actually_ run at 100% will be longer than the accumulated balance. For example, a `shared` CPU with a burst balance of 500 seconds can burst for `500/(1-.0625)` = 533 seconds. This adjustment is already applied to the burst balance displayed in the dashboard panel.
## Monitoring
We publish a number of [Instance Load and CPU](/docs/monitoring/metrics/#instance-load-and-cpu) platform metrics you can use to monitor quota and throttling behavior of your Machines. The easiest way to visualize these metrics is on the [CPU Quota Balance and Throttling](https://fly-metrics.net/d/fly-instance/fly-instance?viewPanel=69) panel, on the [Fly Instance](https://fly-metrics.net/d/fly-instance/fly-instance) dashboard in [Managed Grafana](/docs/monitoring/metrics/#managed-grafana):
On the dashboard, utilization (0-100%) is displayed as a per-vCPU average, divided by the total number of vCPUs in the instance. (There is also a Per-CPU Utilization panel for a detailed breakdown of utilization across each individual vCPU, but because quotas are shared between a Machine's vCPUs only the average matters to the enforced limits.)
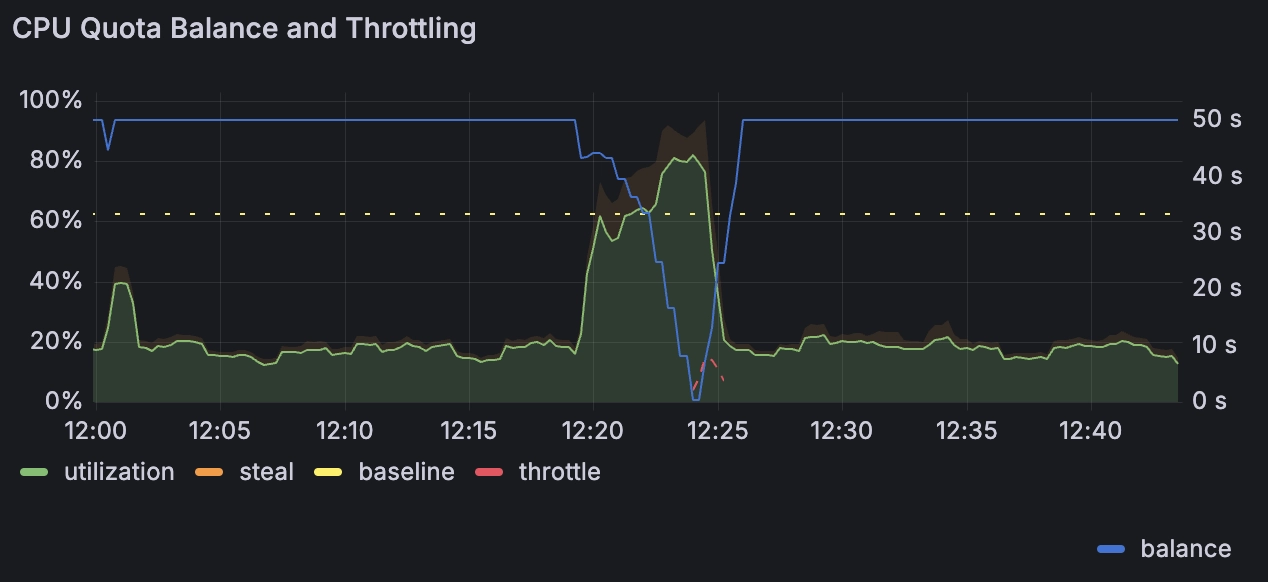
Here, we can see a Machine whose `utilization` was running well below its `baseline` quota of 65%, and had accumulated a 50-second burst `balance`. Then, during a burst of activity, CPU utilization exceeded the baseline quota, causing the balance to drain. When the balance reached 0, the Machine was briefly `throttle`d. When CPU utilization went down, throttling ended and the balance accumulated again.
A related and somewhat misleading metric is CPU steal. You can see this under the `mode=steal` label in the `fly_instance_cpu` metric. Steal is the amount of time your vCPUs are waiting to run, but the scheduler isn't allowing them to. This can happen when your Machine exceeds its quota and is throttled, but it can also be a sign that other Machines on the same host are competing for resources. In our dashboard panels, we visualize `steal` separately from other CPU utilization since it doesn't consume any CPU quota. We publish a separate `fly_instance_cpu_throttle` metric that only includes time your vCPUs were throttled for exceeding quota.
CPU Performance
We offer two kinds of virtual CPUs for Machines: shared and performance. Both run on the same physical hardware, have the same clock speed, etc… The difference is how much time they are allowed to spend running your applications.
CPU Type
Period1
Baseline Quota1
Initial Burst Balance1
Max Burst Balance1
shared
80ms
5ms (6.25%)
5s
500s
performance
80ms
80ms (100%)
-
-
We enforce limits through the Linux scheduler’s CPU bandwidth control by adjusting the cpu.cfs_quota_us setting on each machine cgroup. For each 80ms period of time, we set a quota of 5ms for each shared vCPU, or the full 80ms period for each performance vCPU. If your machine cgroup’s CPU usage reaches its quota, its tasks will be ‘throttled’ (not scheduled to run again) for the remainder of the 80ms period.
Quotas are shared between a Machine’s vCPUs. For example, a shared-cpu-2x Machine is allowed to run for 10ms per 80ms period, regardless of which vCPU is using that time.
1 We might change these specific numbers over time.
Bursting
APIs and human-facing web applications are sensitive to latency and a 75ms pause in program execution is often unacceptable. These same types of applications often work hard in small bursts and remain idle much of the time. To improve the performance of shared vCPUs for these applications, we allow a balance of unused CPU time to be accrued. The application is then allowed to spend its balance in bursts. When bursting, the vCPU is allowed to run at up to 100%. When the balance is depleted, the vCPU is limited to running at its baseline quota.
Because the burst balance is only used for utilization above the baseline quota, the amount of time a machine can actually run at 100% will be longer than the accumulated balance. For example, a shared CPU with a burst balance of 500 seconds can burst for 500/(1-.0625) = 533 seconds. This adjustment is already applied to the burst balance displayed in the dashboard panel.
On the dashboard, utilization (0-100%) is displayed as a per-vCPU average, divided by the total number of vCPUs in the instance. (There is also a Per-CPU Utilization panel for a detailed breakdown of utilization across each individual vCPU, but because quotas are shared between a Machine’s vCPUs only the average matters to the enforced limits.)
Here, we can see a Machine whose utilization was running well below its baseline quota of 65%, and had accumulated a 50-second burst balance. Then, during a burst of activity, CPU utilization exceeded the baseline quota, causing the balance to drain. When the balance reached 0, the Machine was briefly throttled. When CPU utilization went down, throttling ended and the balance accumulated again.
A related and somewhat misleading metric is CPU steal. You can see this under the mode=steal label in the fly_instance_cpu metric. Steal is the amount of time your vCPUs are waiting to run, but the scheduler isn’t allowing them to. This can happen when your Machine exceeds its quota and is throttled, but it can also be a sign that other Machines on the same host are competing for resources. In our dashboard panels, we visualize steal separately from other CPU utilization since it doesn’t consume any CPU quota. We publish a separate fly_instance_cpu_throttle metric that only includes time your vCPUs were throttled for exceeding quota.
